
GomOrderFlowPro Order Flow Analyzer
Video : Watch our futures.io orderflow webinar here
GomOrderflowPro displays candle data internals : sells, buys, delta and associated calculations ; it computes buy/sell imbalances and builds associated S/R zones.
Plots are available for building strategies or populating Market Analyzer with the calculated data.


Documentation
Default Hotkeys
| NinjaTrader 7 and Sierra |
NinjaTrader 8 |
HotKey Description |
| Ctrl + Space Bar | Ctrl + Space Bar | Change focused indicators |
| Divide key on numerical pad | Ctrl Divide | Toggle Text Mode |
| Multiply key on num. pad | Ctrl Multiply | Toggle AutoScale On/Off |
| Decimal key on num. pad | Ctrl Add | Toggle Color Mode |
Important notices
NinjaTrader 7 users:
The file used to read ticks is determined by the DeltaCalculation setting.
If it is BidAsk, the indicator will record bid/ask "Gom" data files in "My Documents\GomProFiles" . If the computer or indicators are not running, there will be missing history data.
If it is UpDownTick, the indicator will use the NinjaTrader tick files. To ensure their availability, there must be a chart based on tick data series running for the instrument. A tick-chart is any chart that is not minute or day based. In this mode the NinjaTrader setting "Tools/Options/Data Save chart data as historical" must be set to true.
In any case, if there is missing data in the data source, a yellow alert message box will be shown and the missing bars painted in yellow.
NinjaTrader 8 users:
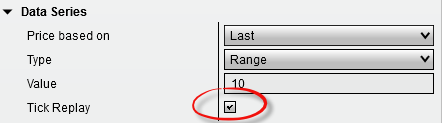
The indicator will use the NinjaTrader integrated files, no more recording is necessary. However, the data series must be in ""Tick Replay" mode.
This mode must be globally enabled in NinjaTrader options, "Tools/Options/Market Data/Historical" : set "Show Tick replay to true"
Then on the chart data series, it must be checked.
In any case, if there is missing data in the data source, a yellow alert message box will be shown and the missing bars painted in yellow.
Changelog
Check latest additions on the blog here