GomBang: MultiTimeframe MultiTops
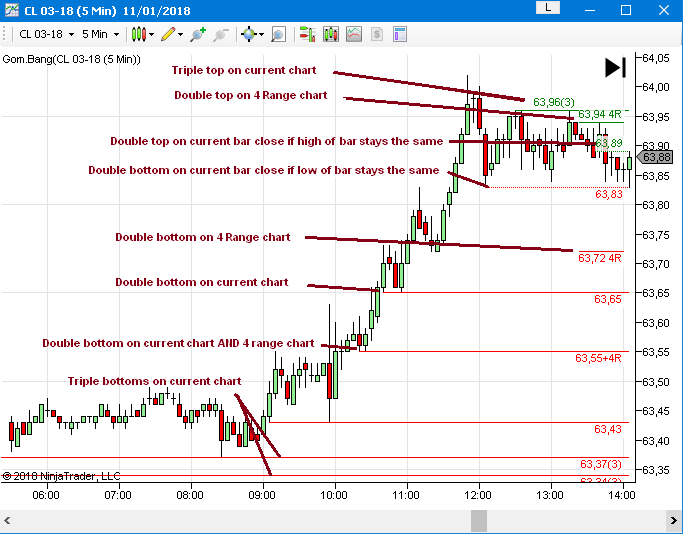
GomBang displays double/multitop levels on the chart, with the unique ability to merge the levels from multiple charts and timeframes.
For instance, if it is displayed on 5 minute, a 4 range and a 800 tick chart, then the 5 minute chart will display double/multitop levels from the 5 min, the 4 range and the 800 tick.
The number in parenthesis next to the price levels is the number of times the price has been touched (if greater than 2)
Settings
Publish
When true, the chart publishes its GomBang levels to the other charts.
Name
The indicator will automatically compute a name for the chart's levels, like 5M for 5 min or 4R for 4 Range. This name can be overriden with the parameter.
Setting the parameter to empty will reenable the default naming scheme.
Subscribe
When true, the indicator will plot the levels published by the other charts.
Show own
If true, the chart will plot its own levels and the levels published by the other charts.
If false, it will only plot levels from the other charts
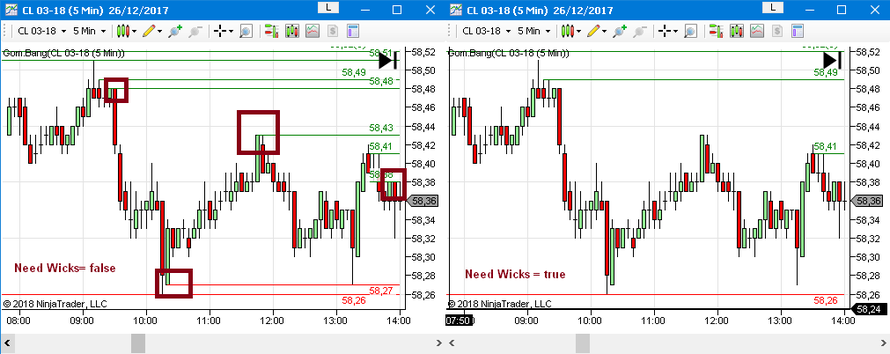
Need Wicks
If true, bar high/low will be considered for a multitop only if they are at the edge of a wick (ie different from open and close). This tends to show price has been already rejected by the top/bottom.
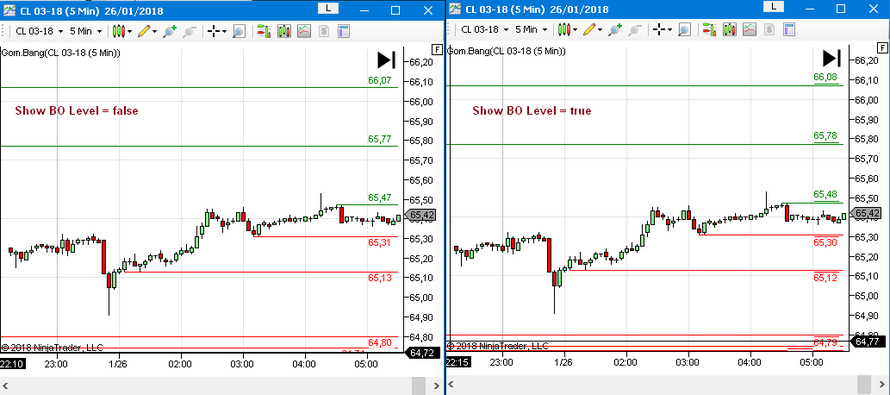
Show Breakout Level Instead of DB/DT Level
When this setting is true, one tick is added above the double top or below the double bottom to show the price of an actual breakout
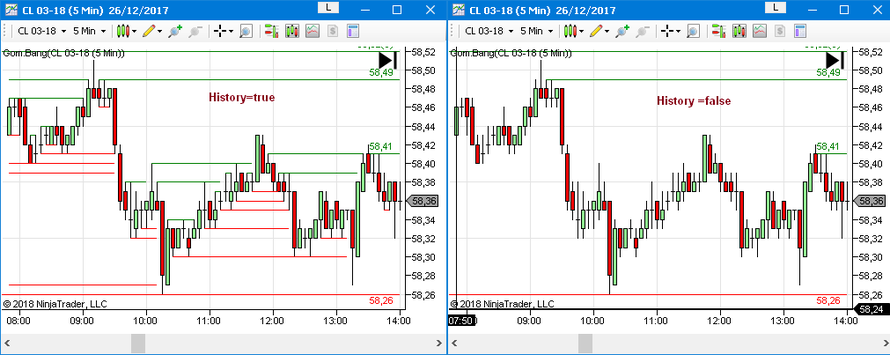
Show History
When true, historical GomBang levels are displayed
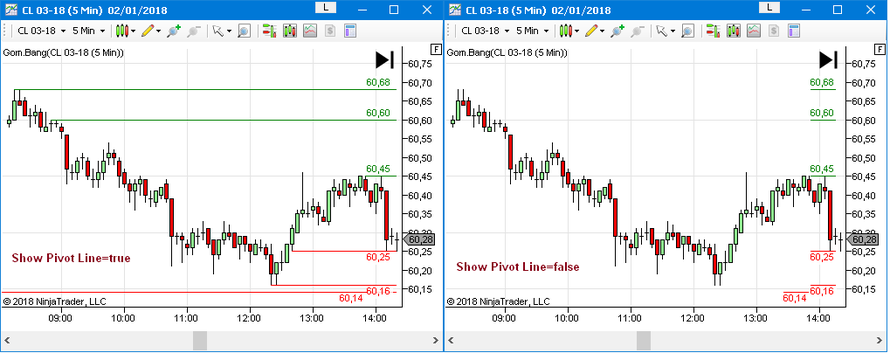
Show Pivot Line
If true, the line connecting all the tops will be shown.
If false, only the price levels are shown
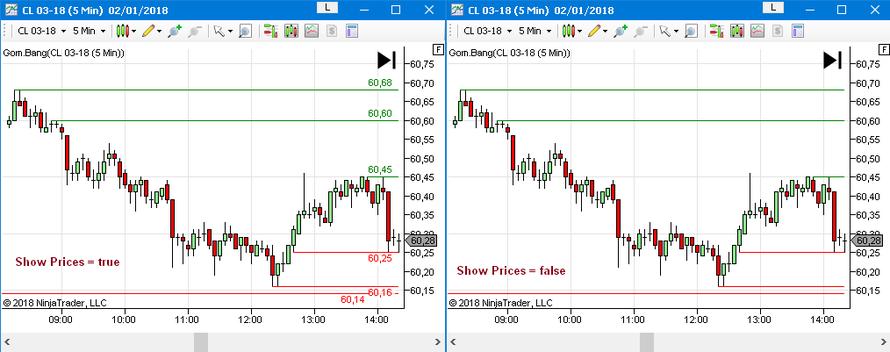
Show Prices
If true, GomBang levels prices will be displayed as text.
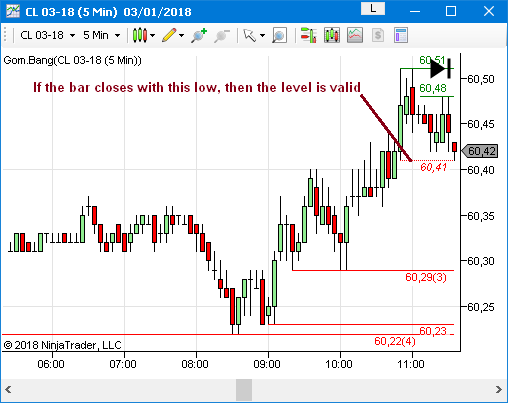
Show Potential GBs
If true, potential GomBangs levels will be plotted while the bar is still not closed.
If the current bar makes a high or a low that is matched with another previous high or low, then it can be considered as potential GomBang Level, ie if the bar closes with the same high or low, then the level becomes valid.
While it is still potential, level is plotted using a dotted line and italics font.
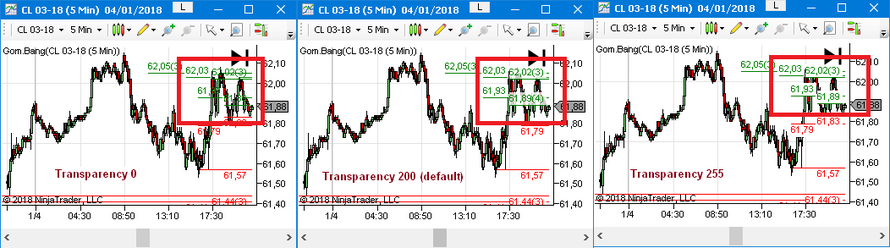
Background Transparency/Opacity
0-255 number setting the intensity of the color painted behind the text of the price values.