
Please check the documentation downloadable here for more information. New functionalities can be found by searching for "new in 2.5"
The new package include the following updates
Reversal Analysis
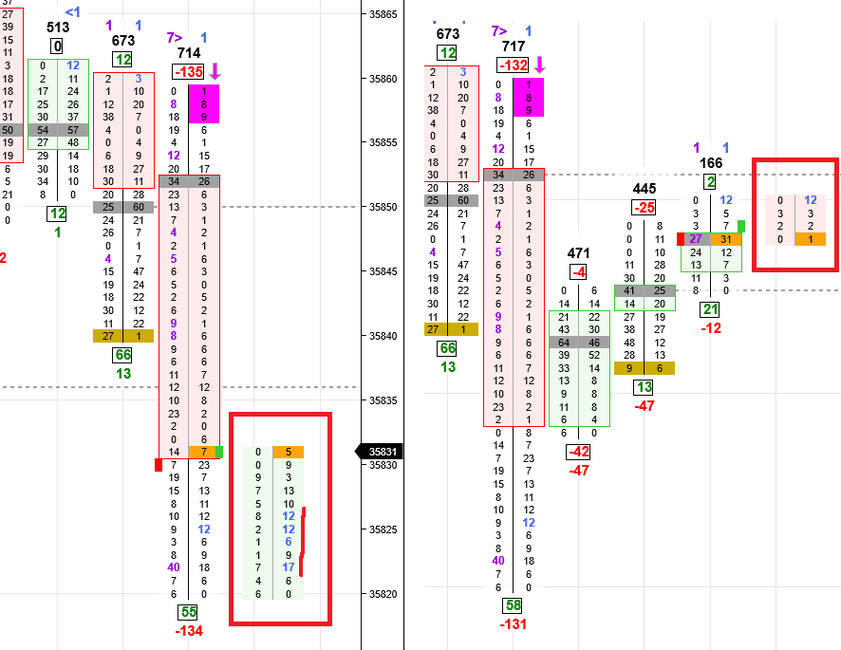
Pullback Column
This is special kind of orderflow bar that is displayed next to the last bar ; this bar is reset each time price makes a new high or a new low.
As a consequence, if there is new high that is a fake BO, the pullback column will actually show the aggressive selling that's not necessarily visible in the main bar.
Here's an example, you can see the buying in the pullback column when the market made a fake new low
Time Since Last Touched Top or Bottom
Again, this can be used to gauge the power of a reversal move.
It will show the time since the bar last touched the top or bottom of the bar
For instance, if you're on a range chart and there is a reversal move, you expect to see a failed breakout on one side and a fast move on the the other side. So you expect the time of last touch of the failed priced to be small.

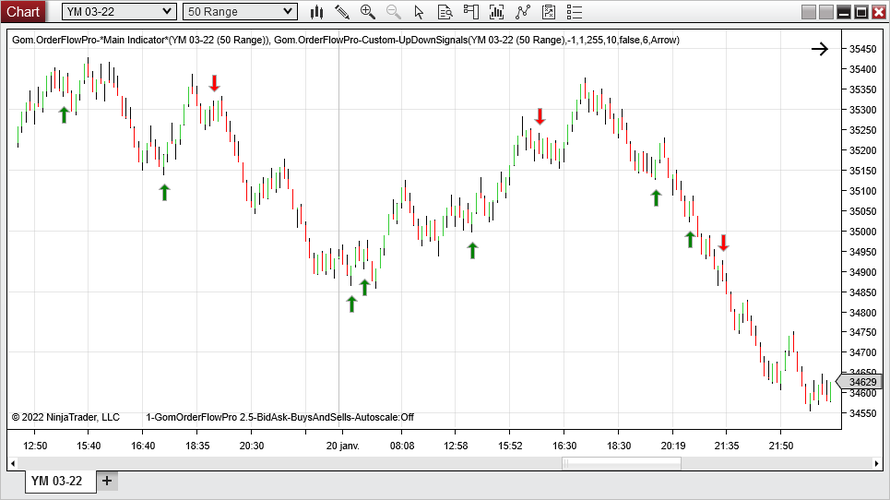
You can also use this in custom signals using formulas (in NinjaTrader), so here's an example : suppose we want the previous bar to be in the other direction than the current bar, and we want the time since last touch the be smaller than the 1/5th of the duration of the previous bar (we are trying to assess some kind of acceleration here...)
We use :

And we get :
The Times since last touch and BarDuration are also available as Plots in the Value indicator
Orderflow analytics
A couple of new tools are available
Diagonal Delta
Diagonal Delta can now be used instead of lateral delta in the bar text

Sweeps
This will show the number of empty prints on either side of the orderflow.
If there is a powerful move, you expect to see some "holes" on the losing side because the lack of aggressive action on the other side of the move.
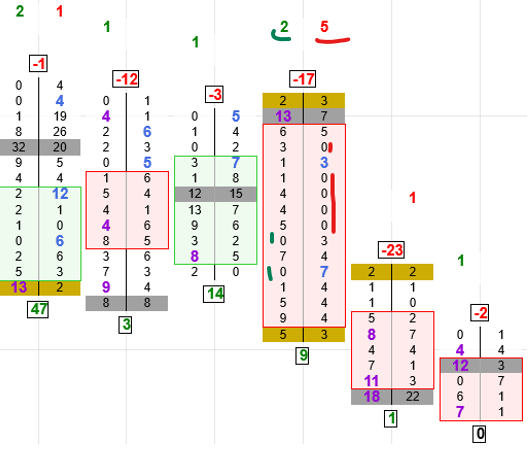
These number can be used to help gauge the power of a move :
Again, we can use this in custom formulas (in NinjaTrader), so let's create custom signals each time we have a sweep > 10 on one side
Formula :

We get :

The SweepsAtBid and SweepsAtAsk are also available as Plots in the Values indicator
Unclutter the charts
Using Formulas
Too many numbers is really an issue when you need to take fast decisions.
It is important to be able to hide unimportant numbers and only keep the significant ones to help cognitive processing.
Color differences are also important because they can help to quickly show thresholds or specific values.
In order to do that, a formula is now associated with each item that can be shown on top and bottom of the candle, and this formula is designed to set the color that will be used to show the data.
- The value of the item is called "Value" in the formula
- If transparent color is used, the data will not be shown
Formula is for example :
if (Value<0,Red,if(Value>0, Green, Transparent))
This is an Excel-like formula and reads
if the Value is greater than 0
Color is Red
else is Value is smaller than 0
Color is Green
else
Color is Transparent
Simple Example
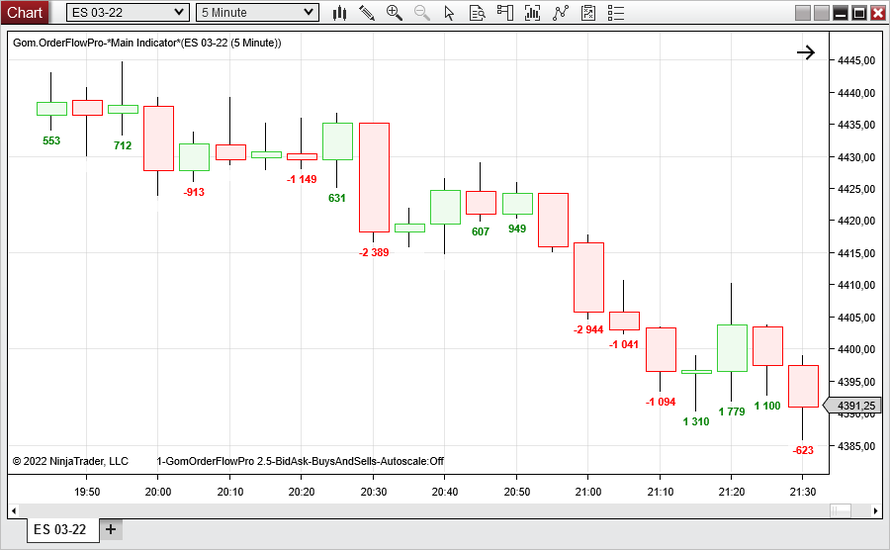
For instance if you want to show only Delta>500 or <-500, you use :
if(Value>500,Green,if(Value<-500,Red, Transparent))
We get ;
Full example
Now Suppose now you want to see
- Delta ony if >100 or < -100
- Sweeps only if > 10
- Ratios only if <1 (Blue) or >10 (Orange)
Here is how it can be implemented :

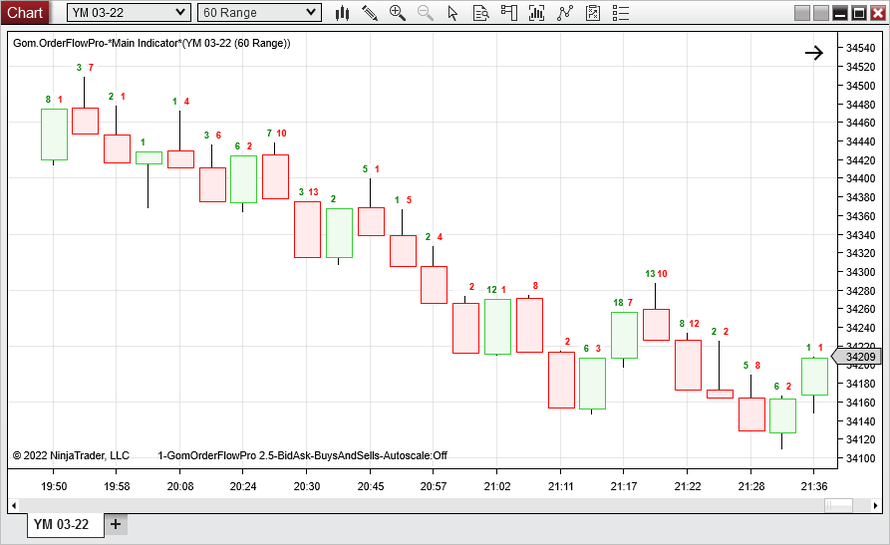
Here is what the chart would look like without the custom colors :
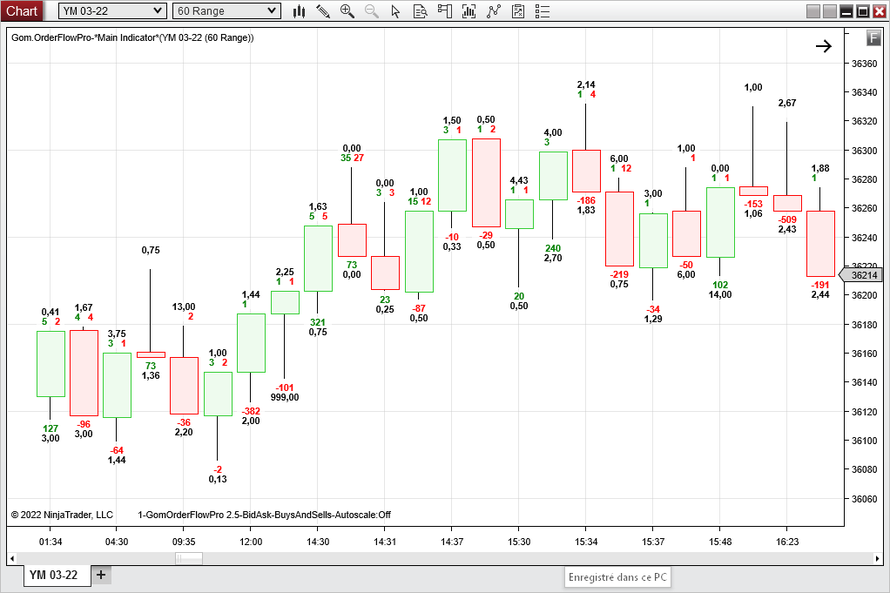
With custom colors :

Alerts & other stuff
Alerts
It is now possible to play audio alerts when a S/R zone is invalidated
Other graphical stuff
- The label on the bottom (GomOrderFlowPro 2.5 - ......) can be disabled or shortened.
- The candle outline thickness can be set
- The font size of the external candle numbers (Delta, Ratios etc) can be set.
If you expired your trial credits, you can request a new 7 day trial to explore new features.